This chapter covers the visualization and charting tools within EQuIS Professional.
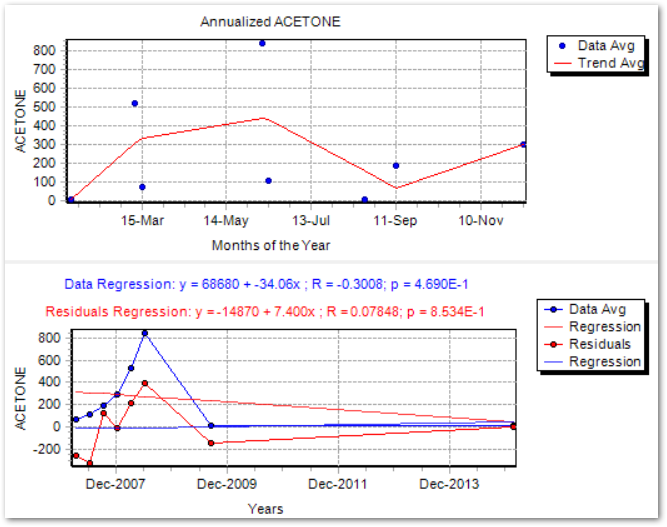
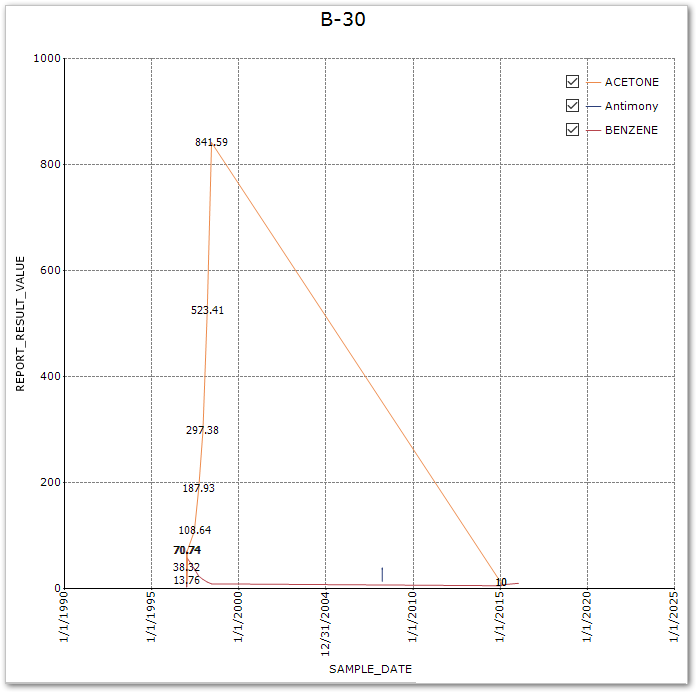
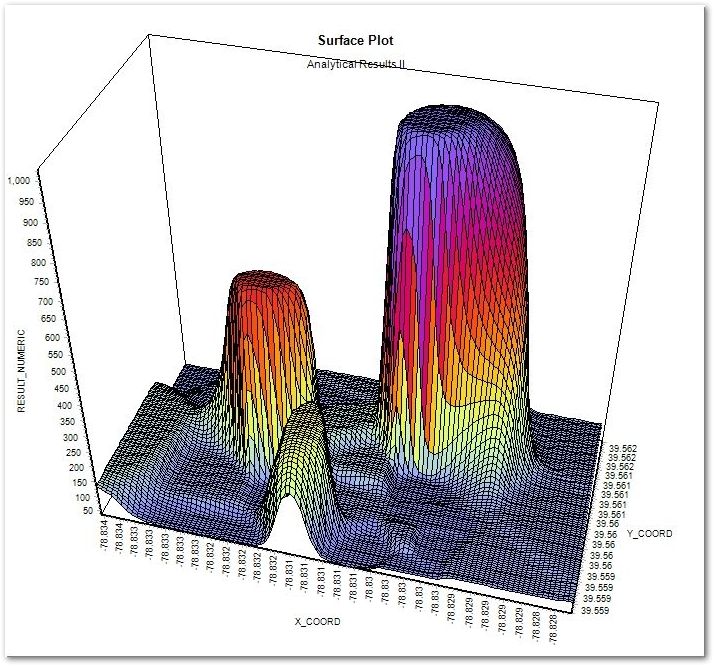
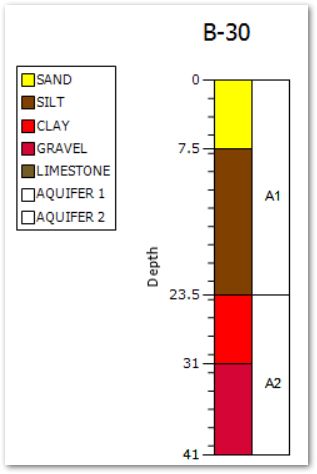
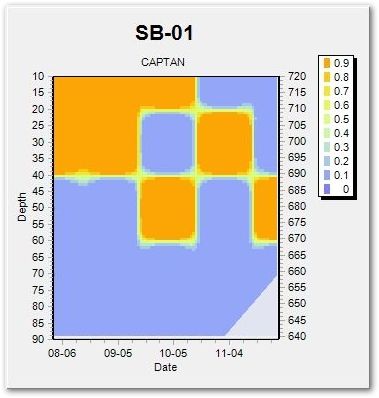
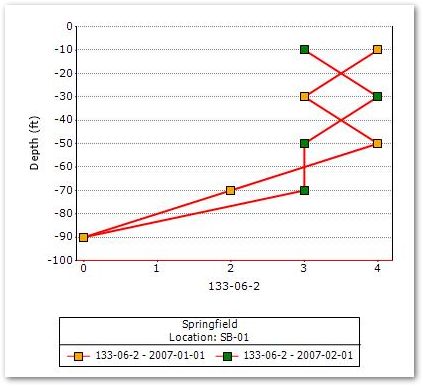
The legacy TeeChart chart options from EQuIS 6 are still available, as well:
Other parts of EQuIS have similar functionality:
EQuIS Reports and Forms – Report Definition Language (RDL) reports, standard reports in the Reports with Graphs section of the EQuIS Library, EQuIS Professional forms included with the EnviroInsite Module
EQuIS Enterprise – Drilldown Widget, RDL Report Viewer (for published RDL reports containing charts), Scatter Plot Widget, Time Series Chart Widget, and Vertical Profile Chart Widget
EQuIS EnviroInsite – options described under the Measured Data, Geochemistry, Boring Logs, and Full Page Chart sections
EQuIS Live – chart widgets (for more information, see Live Widgets)
EQuIS Data Connector for Microsoft Power BI – charts on a Power BI dashboard